We are using cookies to give a better service experience. By using our services you agree to use cookies. Read more

Accept
Reject
Spotlights
All articles
search
clear

Mend the Gap, Powered by Kimche

Working with schools to close achievement gaps in K-12 education.

Schools around the world have long struggled to provide every student (especially those most vulnerable) with a personalized educational experience. We automate data processing & create meaningful visualizations so that schools can reach every student and close gaps across race, gender, and economic status. We serve over 40,000 students, save schools lots of $$ and change student lives.

Overview

Information on this page is provided by the innovator and has not been evaluated by HundrED.

Web presence

2018

Established

-

Children

2

Countries
Updated
December 2018
Closing the achievement gap

About the innovation

What we do

The mission of Mend the Gap is to close the achievement gap. We do this through automated and customized data visualizations and reports. It's very exciting because we get to help schools do more of what they do well (working with students and families) by automating the difficult process of processing data.

Our platform is fully customized to meet the needs of your school/district. We focus on your specific needs and then build beautiful and meaningful visualizations that give you the information that you need to support all of your students. For example, one of our partner schools in Santiago, Chile wanted to improve their attendance rates because they noticed that too many students were chronically absent. We built a visualization like the one you see below to uncover the why behind student absences.


Getting to the why and beyond the what is a key part of what makes Kimche such an important tool. The reality for schools is that they are always working very hard with limited resources, so having the capacity to dig deep into data intersections is one that is often unobtainable. We remove that barrier and give you direct access to your visual data and update it on a weekly basis so that you are constantly gaining new insights into the needs of your students.

Our flagship product is called Kimche. In the indigenous Mapuche culture of South America, Kimche means "wisdom." We wish to provide all educational stakeholders the wisdom that comes from making sense of big data and individualizing student supports. We have made tremendous progress in Chilean schools in the specific areas of attendance and retention and are ready to scale our efforts.

We have a great track record of positive results with our partner schools. We work with schools to identify areas of need and support and then design our visualizations and reports on those needs. Schools all use multiple data points from semi-annual benchmark assessments, anecdotal evidence, as well as academic performance, attendance, behavior, and health data. Schools often meet in teams to help navigate their way through these disparate data sources to better support the needs of individual students. Kimche by Mend the Gap serves as the solution between data collection and intervention.
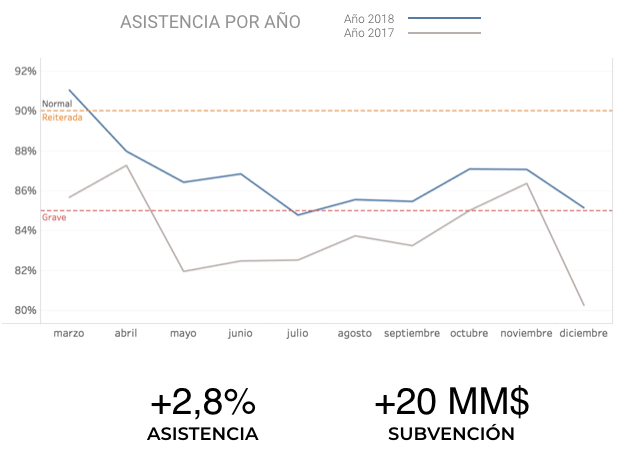

Kimche has increased attendance rates throughout Chile and increased state subsidies to schools by millions of dollars! The state subsidy in Chile is directly connected to attendance so when attendance goes down so does the amount of funding for a school. This specific issue allowed us to customize Kimche to address attendance in schools, resulting in a year over year increase of attendance of 2.8% and a national subsidy increase of over $20,000,000!

We are unique in our commitment to solving problems and customizing our solutions to the needs of individual customers and that approach has proven successful. Our approach is always to support each individual student and we do that by giving schools access to important student information in easy to understand and easy to use visualizations.

Our visualizations help schools look at historic data to optimize plans for the future. Seeing longitudinal data in practice is powerful and has the ability to transform how schools support each student and we are proud to help make this happen. 

We are ready to scale globally after a number of documented successes in Chile. Mend the Gap is based in Pittsburgh and we are committed to making a difference here at home. With a product that's ready to use in schools across the world, we are eager to start getting feedback from our local community and start closing the achievement gap.

Media

Big Data and Education
The increase of technologies, social networks and connectivity in general, has brought a big change in communications. For every minute that goes by, more than 200 million e-mails are sent to the world, 48 hours of video are uploaded to YouTube, more than 6,000 photographs are uploaded to Instagram, more than 560 websites are created, etc. Schools are not immune to the is phenomenon. How many notes, attendance records or annotations in a grade book are generated in a school per week? What applications can Big Data have in the field of education whether in the classroom, with administration, or at home? Imagine the advantages of being able to visualize and cross information about grades, attendance, risk of failure, gender gaps and more. What decisions or measures do you think a teacher can take when she notices that every time a certain student is missing, it is Monday? What if a UTP (academic coordinator) noticed the great gender gap in a subject taught by a certain teacher? The management and analysis of data can help detect early cases for attendance, low grades, even cases of abuse or bullying. Data visualizations allow us to have a broader and clearer picture of what is happening in a school, and analyzing that data allows us to make better and more informed decisions. Rodrigo Herrera (2018) published in a column in the newspaper La Tercera: "The application of intelligence in Big Data has already been implemented in some initiatives, such as measuring from the assistance and student performance in real time, allowing a virtual counselor to guide the person on what subjects should be reinforced, in addition to better organize their study times. (...) We are not only witnessing the fourth industrial revolution, but also the next step towards education for the future. " Sources: Munesh, K. & Pooja, M. (2014) Big data: a Review. International Journal of Computer Science and Mobile Computing, Vol.3 Issue.7, July- 2014, pg. 106-110 Beneyto, R. (2013) How Much Information Is Generated and Stored in the World? Documania 2.0. Retrieved from https://documania20.wordpress.com/2013/09/16/cuanta-informacion-se-genera-y-almacena-en-el-mundo/ Herrera, R. (2018) Column of Education: Big Data, the new way to manage education. The Third Online, retrieved from https://www.latercera.com/tendencias/noticia/columna-educacion-big-data-la-nueva-forma-gestionar-la-educacion/315542/ 
5 keys to combat chronic school absenteeism
Chronic early absenteeism is defined as missing more than 10% of the days of the school year, that is, having an attendance below 90%, which can have a severe impact in the future. Learn how the Ramón Barros Luco Industrial High School tackled this problem and achieved the highest average attendance of the schools in our platform, with 95.2%. The chronic absenteeism (have an attendance less than 90% ) can have very negative consequences on student performance is a problem that should not be taken lightly. The results of a study conducted in Chile by the Oportunidad Foundation show that in pre-school, more than 66% of students suffer from chronic absenteeism . He says: " The main effects of absenteeism in early childhood, are associated with worse results in mathematics and language in 1st and 5th grade, but also with problems of self-esteem and socialization , which can also be related to long-term effects, such as school dropout and failure academic, among others . "(Fundación Oportunidad, 2015). We went to see the case of the Ramón Barros Luco Industrial Liceo , where in 2017 there were 130 cases of chronic absenteeism. Although the average total attendance of the high school was 92%, looking more closely, they realized that there were many students who had less than 85% attendance (minimum required by the Ministry of Education). We were received by their director Iris del Carmen Verdugo , who after reading the study of the Oportunidad Foundation took it as a personal task to improve attendance at the school. We talked with her to find out how they managed to improve attendance with such good results. 1. Value student attendance The first thing Iris emphasizes, is to create a culture around the importance of student participation, so that both teachers and students understand the negative impact of missing classes. In the short term, the absence brings problems of socialization to the students. Students fall behind and are unsure of how to get caught up or are overwhelmed by the amount of work required. 2. Be consistent The second key to handling assistance according to Iris, is perseverance. "We have been very consistent with the issue of assistance, it is not an isolated activity . Monthly, or sometimes every 15 days , we review the evolution of the figures." The director highlighted that when reviewing Kimche's reports, he immediately realized where the problem was because they are very visual. For example, he noticed that the IVºA had a notoriously lower attendance on Tuesdays. When investigating what happened on Tuesdays that caused this rise in non-attendance, he was able to detect a problem that there was at the course level with a particular group of students who were struggling in that particular course. In another situation, he noticed that the IºA was missing a lot on Thursdays. It turned out that it was an academically very "heavy" day for particular students, so they considered ways to restructure the schedule to better support student needs. 3. Highlight the positive Third important factor according to Iris, is not only to focus on students with low attendance, but also to highlight and congratulate the students with good attendance (over 97% is considered outstanding). At the anniversary ceremony of the Ramón Barros Luco Industrial Liceo, with the representatives present, they awarded a diploma to all students with 100% attendance , which was more than 150 (out of a total of 760 students). On another occasion they sent a letter to all students with outstanding assistance, where they recognized them for their responsibility, dedication and commitment, and their families for providing the necessary support. 4. Communication Fourth, communication is very important . "We asked for the help of the chief teachers, who in their weekly hour of attention of parents focused on calling the parents of these missing children", said Iris. As stated before, it is good to communicate both with the parents of the students with outstanding attendance and with those who are at risk of repeating due to absence or who present chronic absenteeism. 5. Set concrete goals Finally, a factor that determined the high percentage of attendance of Liceo Industrial Barros Luco, was to set specific goals both at school level and per student . Having an attendance of 92%, they proposed to raise it to 94%, and achieved 95.2% . This was achieved through letters of commitment to the students, which established that although the Ministry requests a minimum 85%, missing more than 10% of the school year already involved a risk in several ways, so that students they had to commit to meet at least 92% attendance. "The most important thing is to create for these children a culture of assistance , which we clearly have as a mission. We are preparing them to go to the world of work , it is a very good practice that they understand now that assistance does matter , in school and at work . It is a culture that has to be developed, that will impact for good throughout its life ". Many thanks to Iris del Carmen Verdugo for their advice, and congratulations to the Liceo Industrial Ramón Barros Luco for their excellent results in attendance.
How does Chile measure school retention?
Little known are the numbers of school dropouts in Chile, their impacts and associated risk factors. According to ECLAC data, in Chile, 10% of high school students drop out of the education system, the figure being more intense in difficult contexts, in which 8 out of 10 cases correspond to students in poverty. As indicated by MINEDUC figures, school dropouts are higher for the first two socioeconomic quintiles and in secondary education, specifically in I and III. Fig 1. Incidence rate of school dropout by grade Source: Corporación Option based on MINEDUC statistics . The risk factors (or early warning) associated with dropping out are key when understanding the problem, according to the Technical Guidance document School Retention Plan Middle School Level developed by MINEDUC, these correspond to: Low average grades and student performance Low attendance to classes 2 or more course repetitions Discipline problemsSecond language students Mothers or teenage parents who continue to attend regular school. In the same way, other associated risk factors correspond to: Consumption of drugs and alcohol by children and young school system dropouts Consumption of drugs in the student 's immediate environment The quality agency , since the emergence of the SAC (Quality Assurance System) law, included the dimension of school retention as part of a more comprehensive vision of quality in education. As indicated by the agency, the indicator assesses the capacity of an educational establishment to achieve the permanence of its students in the formal education system. The spirit behind the measurement is that students remain in the formal educational system so that they acquire the knowledge, skills and attitudes expected to be developed during their school years. Sources [1] Results Report Performance Category 2016, Quality Assurance System. [2] Instagram image by @martina_illustrates
School Attendance Results
The school attendance , as we have discussed in other columns , is key for those students develop the knowledge , skills and attitudes that are expected to learn during their education. It also contributes to their socio-emotional development and promotes fundamental habits for the future life of children and young people, such as responsibility. The attendance of the students on the other hand is linked to the school subsidy , the state provides resources to the schools by attended day, making variable the main source of income of the establishments. This is the double impact of this indicator , both in terms of learning and resources for the school. This is why it is important for the school to understand how the assistance behaves during the year in order to carry out better management. In this opportunity, we studied the data of Kimche (30,000 students in 42 schools with public funding) to give you an overview of the impact of the days of the week on student attendance .  With an average attendance of 90.5% in the schools of Kimche (considered "normal" by the quality agency), we find that in the decomposition it is Friday the day that students attend least with 89% .After identifying the most critical day, we went to study how the attendance of Friday is composed according to different variables, we will start with type of education. From the analysis it is found that both pre-school and professional technical education are those that have the most absence with 87% and 86% respectively. When we double-click on the most critical case for children, we found that on Friday the first media were the most needed, with 88% average attendance , already considered "repeated non-attendance" by the quality agency. Assistance on Fridays for courses for TP media niños We now return to Friday and break it down by other variables, for example by socioeconomic level, according to the SEP category, priority students, preferred and not receiving SEP subsidy. What happens is counterintuitive, usually tends to think that the category assigned by the SEP impacts on school attendance and the truth is that compared to the other groups it is not, both priority and preferential have similar assistance on Fridays .Another interesting comparison is by gender, distinguishing attendance on Fridays between men and women. The reality is that girls are the ones who come on Fridays compared to men , surpassing them in 1 pt. In any case the attendance of both Fridays is under 90% which is not considered within the acceptable levels. Finally, we are going to decompose according to the general average section. The students are grouped with average 6 to 7, 5 to 6, 4 to 5, etc. and intersect with attendance percentages on Fridays. In this case we can observe a clear relationship between the general average and attendance, while a student has a better performance, the data shows that he attends school more on Fridays .  These are some keys to face the phenomenon of school attendance, the important thing is always to start with the general data and decompose them until you reach the cause of the indicator. From then on what remains are the remedial, the school must take actions in this identified group first interpreting the data with qualitative information collected in the field and then designing improvements to increase the indicator over time.

Implementation steps

Identify need
  • Start with a small group of internal stakeholders to think about how your school/district defines student success. Perhaps you want to specifically focus on literacy. Consider the factors that determine a student who is able to read and write on grade level. What are the indicators that show you a student is successful? Perhaps the student's reading level is the final indicator and because on-grade fluency by grade 3 is a major milestone you may decide to use that as a success measure.


  • Now that you've identified a possible success metric we recommend that you view success rates by demographic group (race, gender, SES status). What students at your school are most likely (historically) to achieve reading fluency by the end of third grade? Do success rates look different for different demographic groups? Is there a gap? For example, do female students out perform male students or white students out perform Hispanic students? What have you not been able to provide these students in the past? These are the gaps that we want to close to identifying them will get us started on the right path.


Stakeholder meeting

We like to start with a small group meeting to talk about your current situation and your school's/district's needs. Rather than starting with the technology, we start with a conversation about current initiatives and academic and social needs of your students. If you were able to complete step 1 by yourself that's great. If not, we can have that conversation together so that we best support your needs. We try to determine where to focus first, for example, we might determine that your goal is to have 100% of your students at or above reading level by third grade. This helps to narrow our implementation focus to k-3 students with an emphasis on literacy.


Your specific needs and focus will be unique and related to the needs of your students. This step provides you with the space and opportunity to consider options that weren't available to you previously due to budget or time constraints. We encourage you to think about what could be as opposed to what has been because we want to help you get there.

This step is perhaps the most important step in the entire process because we build your custom solution based on your specific needs. It's important to know that we will expand our efforts over time and can always begin with more than one initiative, but we try to begin with a very clear and specific goal in mind so that we can clearly track progress over time.


List all data sources

Schools use data from a number of different sources including grade books, learning management systems, student information systems, benchmark assessment tools, and more. The work required to analyze data from all of these sources is quite extensive and can be overwhelming for a school so we take that off your hands.

We talk about what data management platforms your school/district is currently using. We have a specific focus on the platforms that have relevant data for the area of focus that we identified in step 2 but also go beyond that because we often find intersections across data points that are otherwise ignored. For example, we have done a lot of work in improving attendance rates at schools because we uncover the underlying reasons of why students are missing school. Just knowing that a student is absent usually isn't enough to determine why a student is absent, especially once absences become chronic. 

Once we know the data sources we work to retrieve historic data and begin to build your customized solution!


Set Goals

Getting to step 4 is a big moment and it's very exciting. We have identified your area of focus and the data sources that we will work with. Now we can set some goals and build a timeline for implementation. Let's say our focus is to get all students to reading fluency by the end of third grade. That's a great focus! So how do we get there? Since we've already identified your data sources we can get a sense of how far you are from getting students to full proficiency by third grade. As we look at your data, we identify possible trends that may exist across race, gender, or SES. This is very important because it allows us to focus attention on students that need the most support which can be helpful when creating a goal. For example, we may determine that, historically, your district does a stellar job at getting most of your students to reading proficiency by the end of third grade but students that come from low SES households are not achieving the same degree of success. This leads us to a goal of improving reading fluency of low SES students on an identified timeframe. 

Our goals will change and get more complex as we begin to analyze more data over time. Because we are processing your data and providing you with visualizations and reports you are going to very quickly have a sense of how students are performing! 

Custom Visualization & Reporting Time!

This is where things get really exciting! We've had a number of meetings up to this point and have been able to identify areas of focus and a specific goal. Now, Mend the Gap will start building your custom platform!


Our visualizations are designed specifically for you to achieve your identified goal, meaning there is never a one size fits all solution. We are here to build a unique model based on your unique needs. Just as no two people are exactly the same, no two schools are exactly the same.


We provide you with access to the platform and then talk about what reports you would like us to automate for you. Schools often choose to have us automate an email report to families and teachers with relevant data on a weekly basis. The great thing about this is that Mend the Gap takes care of the whole process and your key stakeholders are constantly in the loop.

Our visualizations are updated weekly so you get to track progress toward your goal(s) and adjust practices accordingly. Now you are ready to fully utilize Kimche for your day to day needs!


Spread of the innovation

loading map...